 Follow us on Twitter! Follow us on Twitter!
DATA CENTER
INFORMATION CENTER
ABOUT THE NEBRASKA WSC
USGS IN YOUR STATE
USGS Water Science Centers are located in each state.
|
High Plains Aquifer Water-Level Monitoring Study
Water-Level Changes in the High Plains Aquifer, 1980 to 1996
By V.L. McGuire, C.P. Stanton, and B.C. Fischer
U.S. Geological Survey
Lincoln, Nebraska
1997
Introduction
Water-Level Changes, 1980 to 1996 •
Water-Level Changes, 1995 to 1996 •
Regional Variability of Remaining Saturated Thickness • References
The High Plains aquifer underlies parts of eight states--Colorado, Kansas, Nebraska, New Mexico, Oklahoma, South Dakota, Texas, and Wyoming--that are one of the major agricultural regions in the world. The number of acres irrigated by groundwater expanded rapidly after 1940 in this area: 1949--2.1 million acres; 1959--6.1 million acres; 1969--9.0 million acres; 1978--12.9 million acres; and 1980--13.7 million acres (Gutentag and others, 1984; Thelin and Heimes, 1987). In 1990, about 95 percent of the water withdrawn from the High Plains aquifer, or 15.7 million acre-feet, was used for irrigation (Marilee Horn, U.S. Geological Survey, written commun., 1996).
Water-level declines appeared in the High Plains aquifer soon after extensive ground-water irrigation development began. By 1980, water levels in the High Plains aquifer in parts of Texas, Oklahoma, and southwestern Kansas had declined more than 100 feet (Luckey and others, 1981). In response to these declines, the U.S. Geological Survey, in cooperation with numerous Federal, State, and local water resource agencies, began a ground-water monitoring program in 1988 to assess annual water-level change in the aquifer using water-level measurements from more than 7,000 wells. The water-level measurements used in this report were made in winter or early spring, when water levels generally represent nonpumping conditions.
Water-Level Changes, 1980 to 1996

Figure 1. Water-level changes in the High Plains aquifer, 1980 to 1996. The pattern of water-level changes in the High Plains aquifer from 1980 to 1996 (view a high-resolution PDF map) is based on measurements from 5,429 wells (table 1). Areas with substantial water-level declines from predevelopment to 1980 in southwestern Kansas and northwestern Texas continued to decline from 1980 to 1996. Areas that had substantial water-level declines from predevelopment to 1980 in west-central Texas and southwestern Nebraska, however, had considerably slower rates of decline, or rising water levels, from 1980 to 1996 (table 2).
Table 1. Number of observation wells measured for the water-level comparison periods-1980 to 1996 and 1995 to 1996
                     Number of observation wells measured
                    -------------------------------------
State                 1980 and 1996        1995 and 1996
-------------------------------------------------------------
Colorado                   495                   562
Kansas                     809                 1,002
Nebraska                 1,892                 2,664
New Mexico                 159                   157
Oklahoma                   193                   296
South Dakota                37                   103
Texas                    1,825                 2,608
Wyoming                     19                    75
-------------------------------------------------------------
High Plains              5,429                 7,467
The water-level changes in the High Plains aquifer from 1980 to 1996 ranged from a decline of 88 feet for a well in New Mexico to a rise of 48 feet for a well in Texas. The average area-weighted water level in the High Plains aquifer declined 2.8 feet from 1980 to 1996 compared to a decline of 9.9 feet from predevelopment to 1980 (table 2). Considering 1940 as the time of initial irrigation development in the High Plains region, the rate of water-level decline decreased from about 0.25 foot per year (1940 to 1980) to 0.18 foot per year (1980 to 1996). Although much of the reduction in the rate of water-level decline since 1980 can be attributed to an average area-weighted water-level rise of 1.6 feet (or 0.10 foot per year) in Nebraska, water-level changes from 1980 to 1996 for measured wells in Nebraska ranged from a decline of 25 feet to a rise of 26 feet.
Table 2. Characteristics of the High Plains aquifer in 1980 and water-level changes in the High Plains aquifer, predevelopment to 1980, 1980 to 1996, and 1995 to 1996.
[ft, foot; ft/yr, foot per year]
                                                     Average area-weighted water-level change
                                              ------------------------------------------------------
                                              Predevelopment(1940)
                                                  to 1980               1980 to 1996    1995 to 1996
                                              ------------------------------------------------------
                         Percentage of total                              Water-             Water-
           Percentage    volume of drainable                   Rate of    level   Rate of    level
           of total       water in storage       Water-level   change     change  change     change
 State    aquifer area1       in 19801            change(ft)   (ft/yr)     (ft)   (ft/yr)     (ft)
--------------------------------------------------------------------------------------------------
Colorado       8.6             3.7                 -4.2        -0.10       -4.7    -0.29     -0.12
Kansas        17.5             9.9                 -9.9        -0.25       -7.7    -0.48     -0.50
Nebraska      36.6            65.5                  0.0         0.00       +1.6    +0.10     -0.10
New Mexico     5.4             1.5                 -9.8        -0.25       -6.2    -0.39     -1.22
Oklahoma       4.2             3.4                -11.3        -0.28       -3.7    -0.23     -0.97
South Dakota   2.7             1.8                  0.0         0.00       -0.8    -0.05     +0.74
Texas         20.4            12.0                -33.7        -0.84       -6.1    -0.38     -1.44
Wyoming        4.6             2.2                  0.0         0.00       -1.9    -0.12     +0.28
--------------------------------------------------------------------------------------------------
High Plains    100             100                 -9.9        -0.25       -2.8    -0.18     -0.49
--------------------------------------------------------------------------------------------------
1From Gutentag and others(1984, p. 47).
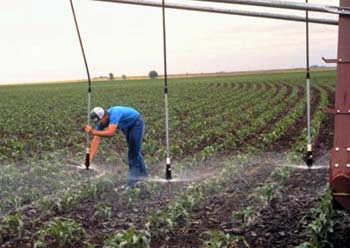
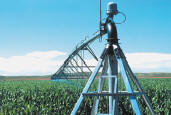
Figure 2. This photograph shows low pressure nozzles and drop tubes on a center pivot in southwestern Nebraska (Photo courtesy of Gary Lee, U.S. Department of Agriculture, Natural Resources Conservation Service). Factors that contributed to the smaller rate of water-level decline since 1980 are: (1) a decrease in ground-water withdrawals from the High Plains aquifer for irrigation-fresh ground- water withdrawals for irrigation were 18.0 million acre-feet in 1980 and 15.7 million acre-feet in 1990 (Thelin and Heimes, 1987; Marilee Horn, U.S. Geological Survey, written commun., 1996); (2) greater than normal precipitation--average annual precipitation from 1981-95 in the High Plains region was 21.10 inches or 1.29 inches greater than normal (table 3); (3) a decrease in irrigated acreage in areas with large potential rates of aquifer depletion, such as in the southern part of the High Plains aquifer; (4) use of more efficient irrigation technology, such as low pressure nozzles and drop tubes on center pivots (photograph at left); (5) improved farm management practices, including irrigation scheduling, reuse of irrigation return flow, and the conversion to alternative crops or crop varieties with smaller consumptive irrigation requirements; (6) local regulation of ground-water withdrawals for irrigation and development of irrigated land; and (7) economic considerations that have forced marginal land out of irrigated production.
Table 3. Average area-weighted precipitation and comparison to 30-year normal precipitation (1961-90) in the High Plains region, 1995 and 1981 to 1995.
[Data from National Oceanic and Atmospheric Administration, National Climatic Data Center, Asheville, North Carolina; data values are in inches]
                            1995                            1981-95
                 -----------------------------    -----------------------------
                                   Departure        Average         Departure
                     Average      from 30-year       annual        from 30-year
State             Precipitation      normal       precipitation       normal
-------------------------------------------------------------------------------
Colorado              19.60          +3.35            17.44           +1.19
Kansas                22.78          +1.47            22.30           +0.99
Nebraska              24.45          +2.67            23.21           +1.43
New Mexico            13.98          -2.41            17.80           +1.40
Oklahoma              20.23          +0.29            20.90           +0.95
South Dakota          26.34          +7.96            20.25           +1.87
Texas                 19.33          +0.52            20.14           +1.33
Wyoming               19.35          +4.92            15.56           +1.13
-------------------------------------------------------------------------------
High Plains           21.78          +1.97            21.10           +1.29
-------------------------------------------------------------------------------
Water-Level Changes, 1995 to 1996
The average area-weighted water level in the High Plains aquifer declined 0.49 foot from 1995 to 1996 (table 2) based on measurements from 7,467 wells (table 1). The average area-weighted water-level change in the High Plains aquifer from 1995 to 1996 by State ranged from a rise of 0.74 foot in South Dakota to a decline of 1.44 feet in Texas (table 2).
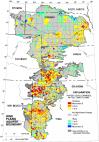
Figure 3. Water-level changes in the High Plains aquifer, 1995 to 1996. Water-level declines of at least 1 foot were common in eastern Nebraska, southwestern Kansas, eastern New Mexico, the Oklahoma Panhandle, and northwestern Texas; water-level declines of more than 3 feet were observed in large areas of southwestern Kansas and the western part of the Texas Panhandle (view a larger screen image | high-resolution PDF image of water-level declines). Water-level rises of 1 to more than 3 feet commonly occurred in parts of northeastern Colorado, south-central Kansas, north-central and northwestern Nebraska, south-central South Dakota, and southeastern Wyoming.
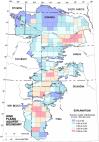
Figure 4. Fresh ground-water withdrawal rates by county during 1995 (data from USGS Aggregate Water-Use Data System, data retrieved April 1998). The water-level changes in the High Plains aquifer result from an imbalance during the period between discharge, which is primarily ground-water withdrawals for irrigation, and recharge, which is primarily from precipitation. Fresh ground-water withdrawals during 1995 in the High Plains region by county ranged from less than 0.02 acre-foot per acre to more than 0.50 acre-foot per acre (view a larger screen image | high-resolution PDF image of ground-water withdrawals); more than 95 percent of these withdrawals were for irrigation. Ground-water withdrawals for irrigation are affected by climatic conditions, particularly precipitation, which can cause large variations in water requirements for a given year's crops.
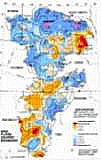
Figure 5. Annual precipitation, 1995, and departure from 30-year normal precipitation (1961-90) (precipitation data from the National Oceanic and Atmospheric Administration, National Climatic Data Center, Asheville, North Carolina). The area-weighted average precipitation during 1995 in the High Plains region was 21.78 inches; precipitation during 1995 in the High Plains region was 1.97 inches greater than the 30-year normal (table 3). In 1995, precipitation was more than 2 inches less than normal in southwestern Kansas, eastern New Mexico, southeastern Nebraska, the western part of the Oklahoma Panhandle, and northwestern Texas (fig. 5: view a larger screen image | high-resolution PDF image of annual precipitation). The areas with 1995 to 1996 water-level declines of greater than 3 feet in southwestern Kansas, eastern New Mexico, the Oklahoma Panhandle, and northwestern Texas (fig. 3) generally are areas where 1995 ground-water withdrawals were greater than 0.25 acre-foot per acre (fig. 4) and 1995 precipitation was more than 2 inches less than normal (fig. 5). The areas with 1995 to 1996 water-level rises of greater than 1 foot in northeastern Colorado, south-central Kansas, north-central and northwestern Nebraska, south-central South Dakota, and southeastern Wyoming are areas where precipitation was from 2 to 10 inches greater than normal during 1995 (figs. 3 and 4).
Regional Variability of Remaining Saturated Thickness
Changes in the saturated thickness of the High Plains aquifer since predevelopment, calculated for 1980 and 1996, reflect large regional differences in the rate of aquifer depletion (table 4). As of 1996, the percentages of remaining predevelopment saturated thickness ranged from 72 percent in Texas to about 100 percent in Nebraska, South Dakota, and Wyoming. Water-level declines exceeded 100 feet from predevelopment to 1980 (Luckey and others, 1981) and 40 feet from 1980 to 1996 (fig. 1) in parts of southwestern Kansas and northwestern Texas. The remaining saturated thickness in that area of southwestern Kansas is less than 70 percent of the predevelopment estimated saturated thickness; the remaining saturated thickness in that area of northwestern Texas is less than 50 percent.
Table 4. Average area-weighted saturated thickness of the High Plains aquifer, predevelopment, 1980, and 1996
 ----------------------------------------------------------------------------------
                              Average area-weighted saturated thickness
                           --------------------------------------------------------
                                               1980, as a            1996, as a
                                                percent-              percent-
                               Pre-             age of                age of
                             develop-            pre-                  pre-
                              ment      1980    develop-    1996      develop-
   State                     (feet)    (feet)    ment      (feet)      ment

-----------------------------------------------------------------------------------
Colorado                      83.2      79.0      95        74.3        89
Kansas                       110.9     101.0      91        93.2        84
Nebraska                     342.0     342.0     100       343.6       100
New Mexico                    60.8      51.0      84        45.5        75
Oklahoma                     141.3     130.0      92       126.6        90
South Dakota                 207.6     207.0     100       206.2        99
Texas                        143.7     110.0      77       103.9        72
Wyoming                      182.0     182.0     100       180.1        99
-----------------------------------------------------------------------------------
High Plains                  199.9     190.0      95       187.2        94
-----------------------------------------------------------------------------------
References
SELECTED REFERENCES
Gutentag, E.D., Heimes, F.J., Krothe, N.C., Luckey, R.R., and Weeks, J.B., 1984, Geohydrology of the High Plains aquifer in parts of Colorado, Kansas, Nebraska, New Mexico, Oklahoma, South Dakota, Texas, and Wyoming: U.S. Geological Survey Professional Paper 1400-B, 63 p.
Luckey, R.R., Gutentag, E.D., and Weeks, J.B., 1981, Water-level and saturated-thickness changes, predevelopment to 1980, in the High Plains aquifer in parts of Colorado, Kansas, Nebraska, New Mexico, Oklahoma, South Dakota, Texas, and Wyoming: U.S. Geological Survey Hydrologic Investigations Atlas HA-652, 2 sheets, scale 1:2,500,000.
National Oceanic and Atmospheric Administration, 1951-95, Climatological data by state, monthly and annual summaries: Asheville, N.C., National Climatic Center.
Thelin, G.P., and Heimes, F.J., 1987, Mapping irrigated cropland from Landsat data for determination of water use from the High Plains aquifer in parts of Colorado, Kansas, Nebraska, New Mexico, Oklahoma, South Dakota, Texas, and Wyoming: U.S. Geological Survey Professional Paper 1400-C, 38 p.
For more information, please contact:
USGS Water Science Center
5231 South 19th
Lincoln, Nebraska 68512
Phone (402) 328-4100
FAX (402) 328-4101
email info_ne@usgs.gov
 To view a PDF document, you need the Adobe Acrobat® Reader installed on your computer. (A free copy of the Acrobat® Reader may be downloaded from Adobe Systems Incorporated.) To view a PDF document, you need the Adobe Acrobat® Reader installed on your computer. (A free copy of the Acrobat® Reader may be downloaded from Adobe Systems Incorporated.)
 Back to High Plains Aquifer main page Back to High Plains Aquifer main page
|