High Plains Water-Level Monitoring Study (Groundwater Resources Program)
Physical/Cultural SettingThe High Plains aquifer underlies 174,000 mi2 in parts of eight States—Colorado, Kansas, Nebraska, New Mexico, Oklahoma, South Dakota, Texas, and Wyoming. 
The area that overlies the aquifer occupies part of the Great Plains Physiographic Province; the extent of the Great Plains Physiographic Province and High Plains aquifer are shown in the adjacent location map. The Great Plains Physiographic Province is a vast east-tilted surface formed by deposition of sediment eroded from the ancestral Rocky Mountains, beginning about 65 million years ago. The Great Plains Physiographic Province is characterized by gently sloping, smooth plains. The land surface elevation of the High Plains area ranges from about 7,800 feet above the National Geodetic Vertical Datum of 1929 (NGVD 29) on the western boundary to 1,160 feet above NGVD 29 on the eastern boundary. Climate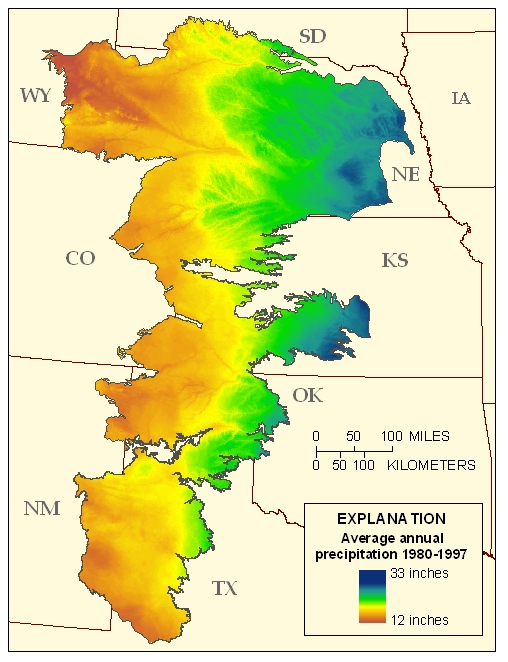 Figure 2. Average annual precipitation in the High Plains from 1980-1997. Data from DAYMET. (Click image for larger version) The High Plains area has a middle-latitude dry continental climate with abundant sunshine, moderate precipitation, frequent winds, low humidity, and a high rate of evaporation. Mean annual temperature ranges from about 43°F in the north to 63°F in the south. Mean annual precipitation ranges from 12 inches in the west to 33 inches in the east (figure 2). During most years, in much of the area, irrigation is required for economic yields of typical crops—alfalfa, corn, cotton, sorghum, soybeans, peanuts, and wheat. History of water development.")
Since the late 1880s, farming has been the dominant industry in the High Plains area and, in some of the area, farmers have irrigated using ground and surface water. For example, in the late 1800s, some farmers were irrigating crops using surface water diverted from the Platte and Arkansas Rivers or some were irrigating using shallow groundwater pumped to the surface by windmills. Through the early 1940s, depth to water in the aquifer and the slope of the land surface were major factors controlling the distribution of irrigated acres. By the early 1960s, technological advances in pumps allowed irrigation in areas with deeper (greater than 100 feet below land surface) groundwater, and the development of center-pivot irrigation systems allowed irrigation on rolling terrain. See USGS Professional Paper 1400B for further information on the history of water development in the High Plains area.  Graph 1. Graph showing the amount of irrigated acres in the High Plains area from 1949 to 2002. (Click image for larger version) In the area that overlies the High Plains aquifer, estimated acreage irrigated with groundwater increased rapidly from the 1940s to 1980, but did not change greatly from 1980 to 2002: 1949-2.1 million acres, 1980-13.7 million acres, 1997-13.9 million acres, and 2002-12.7 million acres (graph 1). However, the proportion of irrigated acreage in each state relative to total irrigated acres did change substantially over time in some states: 1980-21 percent of irrigated acres were in Kansas and 38 percent of irrigated acres were in Nebraska; 2002-15 percent of irrigated acres were in Kansas and 45 percent of irrigated acres were in Nebraska. 
Graph 2. Graph showing the amount of groundwater pumped for irrigation in the High Plains area from 1949 to 2000. (Click image for larger version). Annual ground-water withdrawals from the High Plains aquifer for irrigation, which is compiled about every 5 years by the U.S. Geological Survey and agencies in each State, increased from 4 to 19 million acre-feet from 1949 to 1974; from 1980 to 2000, ground-water withdrawals for irrigation have varied from 2 to 18 percent of 1974 withdrawals (graph 2). Ground-water withdrawals for irrigation in 2000 by county ranged from less than 0.01 million acre-ft to more than 0.25 million acre-ft (figure 3). Current population, land use, and agricultural production Figure 3. Ground-water withdrawals for irrigation by county for water-year 2000. (Click image for larger version) The population of the High Plains area grew from 0.9 million people in 1900 to 2.3 million people in 2000 (figure 4). Forty percent of the people live in the cities with a population greater than 20,000 (2000 census); many of these cities are located near the major rivers or near the aquifer boundary.  Figure 4. 2000 Population by county within the High Plains area. (Click image for larger version) Current land use in the High Plains area is 55.6 percent rangeland, 40.9 percent agricultural, and 3.5 percent a combination of wetlands, forest, urban, water, land barren lands (figure 5). The agricultural lands are comprised of 53 percent rowcrops (such as sorghum, corn, and cotton), 33 percent small grains (mostly wheat), and 14 percent pasture, alfalfa, and fallow lands; 28 percent of the agricultural land is irrigated (USGS National Land-Cover Data, 1992).  Figure 5. Land-cover classification for the High Plains area. Classified from nominal 1992 Landsat imagery. (Click image for larger version) Crops grown in the High Plains area are a substantial percentage of the total crop production for the United States. In 1997, crops grown in the High Plains area accounted for 19 percent of the wheat, 19 percent of the cotton, 15 percent of the corn, and 3 percent of the sorghum. In addition, the High Plains area accounts for about 18 percent of total cattle production and an increasing percent of total swine production in the United States (USDA Census of Agriculture). |

![]() U.S. Department of the Interior |
U.S. Geological Survey
U.S. Department of the Interior |
U.S. Geological Survey
URL: http://ne.water.usgs.gov/ogw/hpwlms/physsett.html
Page Contact Information: GS-W-NE_Webmaster
Page Last Modified: Tuesday, 04-Feb-2014 12:16:51 EST