 Follow us on Twitter! Follow us on Twitter!
DATA CENTER
INFORMATION CENTER
ABOUT THE NEBRASKA WSC
USGS IN YOUR STATE
USGS Water Science Centers are located in each state.
|
High Plains Aquifer Water-Level Monitoring Study
Water-Level Changes in the High Plains aquifer, 1980 to 1998
By V.L. McGuire and B.C. Fischer
U.S. Geological Survey
Lincoln, Nebraska
1998
Introduction
Ground-Water Monitoring Program •
Water-Level Changes, 1980 to 1998 •
Water-Level Changes, 1997 to 1998 •
References
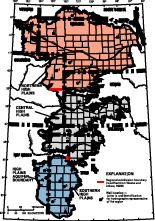 The High Plains aquifer underlies parts of eight states-Colorado, Kansas, Nebraska, New Mexico, Oklahoma, South Dakota, Texas, and Wyoming (fig. 1). In the area underlain by the High Plains aquifer (called the High Plains region in this report), the total number of acres irrigated with ground-water increased rapidly after 1940: 1949-2.1 million acres; 1959-6.1 million acres; 1969-9.0 million acres; and 1980-13.7 million acres (Gutentag and others, 1984; Thelin and Heimes, 1987). Large areas of water-level declines began to occur in parts of the High Plains aquifer soon after the development of extensive ground-water irrigation in those parts of the High Plains region. By 1980, water levels in the High Plains aquifer in parts of Texas, New Mexico, and southwestern Kansas had declined more than 100 feet ( fig. 2). In response to these declines, the U.S. Geological Survey, in cooperation with numerous Federal, State, and local water resource agencies, began a ground-water monitoring program in 1988 to assess annual water-level change in the aquifer using water-level measurements from more than 7,000 wells. The High Plains aquifer underlies parts of eight states-Colorado, Kansas, Nebraska, New Mexico, Oklahoma, South Dakota, Texas, and Wyoming (fig. 1). In the area underlain by the High Plains aquifer (called the High Plains region in this report), the total number of acres irrigated with ground-water increased rapidly after 1940: 1949-2.1 million acres; 1959-6.1 million acres; 1969-9.0 million acres; and 1980-13.7 million acres (Gutentag and others, 1984; Thelin and Heimes, 1987). Large areas of water-level declines began to occur in parts of the High Plains aquifer soon after the development of extensive ground-water irrigation in those parts of the High Plains region. By 1980, water levels in the High Plains aquifer in parts of Texas, New Mexico, and southwestern Kansas had declined more than 100 feet ( fig. 2). In response to these declines, the U.S. Geological Survey, in cooperation with numerous Federal, State, and local water resource agencies, began a ground-water monitoring program in 1988 to assess annual water-level change in the aquifer using water-level measurements from more than 7,000 wells.
Figure 1. Regional subdivisions of the High Plains aquifer, location of selected wells, and links to hydrographs for selected wells. Larger screen image | PDF version
Hydrographs of selected wells (Figure 1A through Figure 1U.): view a larger screen image | PDF version
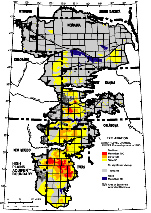 Figure 2. Water-level changes in the High Plains aquifer, predevelopment to 1980 (Luckey and others, 1981). Figure 2. Water-level changes in the High Plains aquifer, predevelopment to 1980 (Luckey and others, 1981).
Larger screen image | PDF version
Purpose
The purpose of this report is to describe changes in water levels in the High Plains aquifer. More specifically, the report presents
- hydrographs of water levels in selected wells screened in the High Plains aquifer and
- maps of water-level changes in the High Plains aquifer between the nonirrigation season (generally October to March) of 1979-80 and the nonirrigation season of 1997-98 (herein referred to as 1980 to 1998) and from nonirrigation season 1996-97 to nonirrigation season 1997-98 (herein referred to as 1997 to 1998); and
- maps of the precipitation pattern in the High Plains region for 1981 to 1997 and for 1997
Map scale and density of data preclude showing small areas of water-level change or precipitation where the value may be more or less than indicated in the maps.
Ground-Water Monitoring Program
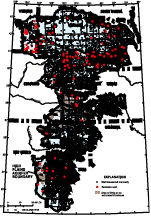 The agencies that participated in the High Plains ground-water monitoring program in 1998 (table 1, below) measured 8,610 wells from the winter of 1997-98 to the spring of 1998 ( fig. 3 and table 2). The agencies manually measured more than 98 percent of the wells, usually one to two times per year; the remaining 116 wells are recorder wells, which are instrumented to measure water levels continually or at specified intervals ( fig. 3). The agencies that participated in the High Plains ground-water monitoring program in 1998 (table 1, below) measured 8,610 wells from the winter of 1997-98 to the spring of 1998 ( fig. 3 and table 2). The agencies manually measured more than 98 percent of the wells, usually one to two times per year; the remaining 116 wells are recorder wells, which are instrumented to measure water levels continually or at specified intervals ( fig. 3).
Figure 3: Wells measured in 1998.
Table 1. Agencies who made the 1998 water-level measurements for the High Plains ground-water monitoring program
Table 2. Number of wells measured in 1998
Hydrographs are used to illustrate seasonal and long-term water-level changes in wells at various locations in the High Plains region (figs. 1-A to 1-U). The 21 wells selected for the hydrographs include wells with recorders and wells that are measured manually. The altitude of the base of the aquifer in the vicinity of the wells also is listed on each hydrograph (modified from Weeks and Gutentag, 1981). The earliest available water level and the latest water level are approximately equal in six of the wells (figs. 1
-A,
-B,
-C,
-E,
-G, and
-I). The latest water level in one of the wells (fig. 1
-U) is 17 feet higher than the earliest available water level for
that well. The latest water levels in the remaining wells (figs. 1
-D,
-F,
-H,
-J,
-K,
-L,
-M,
-N,
-O,
-P,
-Q,
-R,
-S, and
-T) are lower (from 10 to 125 feet) than the earliest available water level for that well.
Water-Level Changes, 1980 to 1998
 The water-level changes in the High Plains aquifer result from an imbalance between discharge and recharge. The largest component of discharge in the High Plains region generally is ground-water withdrawals for irrigation. Recharge is primarily from precipitation. Imbalance began with large-scale development of the aquifer for irrigation. Ground-water withdrawals for irrigation in a given year can be affected greatly by climatic conditions, particularly precipitation that can result in large variations in the amount of irrigation water needed to satisfy the water requirements for crops. The water-level changes in the High Plains aquifer result from an imbalance between discharge and recharge. The largest component of discharge in the High Plains region generally is ground-water withdrawals for irrigation. Recharge is primarily from precipitation. Imbalance began with large-scale development of the aquifer for irrigation. Ground-water withdrawals for irrigation in a given year can be affected greatly by climatic conditions, particularly precipitation that can result in large variations in the amount of irrigation water needed to satisfy the water requirements for crops.
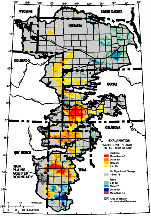
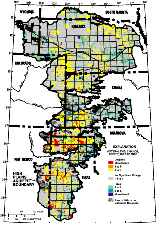
Figure 4: Water-level changes from 1980 to 1998:
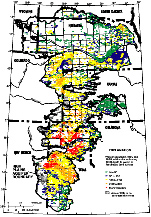 The pattern of water-level change in the High Plains aquifer from 1980 to 1998 ( fig. 4) is based on water-level measurements from 4,964 wells ( fig. 5 and table 3). A large area in the northern part of the southern High Plains aquifer in New Mexico and Texas with greater than 100 feet of water-level declines from predevelopment to 1980 ( fig. 2) has continued to decline, but at a slower rate. The rate of decline in this area from predevelopment to 1980 was 3.7 feet per year; the rate of decline in this area from 1980 to 1998 was 1.6 feet per year. Areas with substantial water-level declines from predevelopment to 1980 in the southern part of the southern High Plains aquifer in Texas and in the southeastern part of the northern High Plains aquifer in Nebraska ( fig. 2) had considerably slower rates of decline, or rising water levels, from 1980 to 1998 ( fig. 4). The pattern of water-level change in the High Plains aquifer from 1980 to 1998 ( fig. 4) is based on water-level measurements from 4,964 wells ( fig. 5 and table 3). A large area in the northern part of the southern High Plains aquifer in New Mexico and Texas with greater than 100 feet of water-level declines from predevelopment to 1980 ( fig. 2) has continued to decline, but at a slower rate. The rate of decline in this area from predevelopment to 1980 was 3.7 feet per year; the rate of decline in this area from 1980 to 1998 was 1.6 feet per year. Areas with substantial water-level declines from predevelopment to 1980 in the southern part of the southern High Plains aquifer in Texas and in the southeastern part of the northern High Plains aquifer in Nebraska ( fig. 2) had considerably slower rates of decline, or rising water levels, from 1980 to 1998 ( fig. 4).
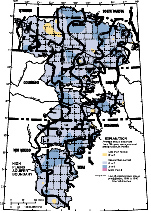
Figure 5: Water-level measurements:
Table 3. Number of wells used for the water-level comparison periods- 1980
to 1998, and 1997 to 1998
Ninety-nine percent of all water-level changes in the High Plains aquifer from 1980 to 1998 are within a rise of 32.1 feet and a decline of 62.7 feet. The average area-weighted water level declined 3.1 feet from 1980 to 1998 compared to a decline of 9.9 feet from predevelopment to 1980 ( table 4). Some of the differences between average area-weighted water-level-change values for periods being compared may be due to differences in the number and spacing of wells measured for the respective comparison periods. Using 1950 as the beginning of irrigation development in the High Plains region, the rate of water-level decline decreased from 0.33 foot per year (1950 to 1980) to 0.17 foot per year (1980 to 1998).
Table 4. Characteristics of the High Plains aquifer in 1980 and average area-weighted water-level changes in the High Plains aquifer, predevelopment to 1980, 1980 to 1998, and 1997 to 1998
[ft, foot; ft/yr, foot per year]
1 Does not include areas of little or no saturated thickness.
2 Modified from Gutentag and others (1984).
3 Luckey and others, 1981.
 Factors that contributed to the smaller rate of water-level decline from 1980 to 1998 as compared to predevelopment to 1980 are: (1) a decrease in ground-water withdrawals from the High Plains aquifer for irrigation, and (2) greater than normal precipitation from 1981 to 1997 ( fig. 6). Ground-water withdrawals for irrigation were 18.0 million acre-feet in 1980 and 15.7 million acre-feet in 1990 (Thelin and Heimes, 1987; Marilee Horn, U.S. Geological Survey, written commun., 1996). Average area-weighted annual precipitation from 1981 to 1997 in the High Plains region was 21.4 inches per year, which is 2.3 inches more than 1951 to 1980 normal area-weighted annual precipitation and 1.5 inches more than 1961 to 1990 normal area-weighted annual precipitation ( table 5). Factors that contributed to the smaller rate of water-level decline from 1980 to 1998 as compared to predevelopment to 1980 are: (1) a decrease in ground-water withdrawals from the High Plains aquifer for irrigation, and (2) greater than normal precipitation from 1981 to 1997 ( fig. 6). Ground-water withdrawals for irrigation were 18.0 million acre-feet in 1980 and 15.7 million acre-feet in 1990 (Thelin and Heimes, 1987; Marilee Horn, U.S. Geological Survey, written commun., 1996). Average area-weighted annual precipitation from 1981 to 1997 in the High Plains region was 21.4 inches per year, which is 2.3 inches more than 1951 to 1980 normal area-weighted annual precipitation and 1.5 inches more than 1961 to 1990 normal area-weighted annual precipitation ( table 5).
Figure 6. Average annual precipitation, 1981 to 1997, and departure from 30-year (1961 to 1990) normal precipitation:
Table 5. Normal area-weighted annual precipitation, 1951 to 1980 and 1961 to 1990, and average area-weighted annual precipitation, 1981 to 1997 and 1997, in the High Plains region
[Data from National Oceanic and Atmospheric Administration, National Climatic Data Center, Asheville, North Carolina, and from A. Dutcher, University of Nebraska-Lincoln, High Plains Climate Center, written commun., 1998; data are in inches per year]
Factors that may have resulted in a decrease in ground-water withdrawals, in addition to increased precipitation, include: (1) a decrease in irrigated acreage in areas with water-level declines and in areas with large potential rates of aquifer depletion; (2) use of more efficient irrigation technology, such as low pressure nozzles and drop tubes on center pivots; (3) improved farm management practices, including irrigation scheduling, reuse of irrigation return flow, the conversion to alternative crops or crop varieties with smaller consumptive irrigation requirements, and methods to retain soil moisture; (4) local regulation of ground-water withdrawals for irrigation and development of irrigated land; and (5) economic considerations, including declining or stable commodity prices, increased production costs (including energy and fertilizer costs), and various agricultural programs of the Federal government that encourage the transfer of marginal land out of irrigated production.
Water-Level Changes, 1997 to 1998
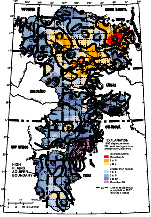
 The pattern of water-level change in the High Plains aquifer from 1997 to 1998 ( fig. 7) is based on measurements from 7,808 wells ( fig. 8 and table 3). Ninety-nine percent of all water-level changes from 1997 to 1998 are within a rise of 8.4 feet and a decline of 9.4 feet. The largest nearly continuous area with greater than 3 feet of water-level decline is north of the Canadian River in Texas. The average area-weighted water level in the High Plains aquifer declined 0.2 foot from 1997 to 1998 ( table 4). The average area-weighted water-level change in the High Plains aquifer from 1997 to 1998 by state ranged from a rise of 0.2 foot in Wyoming to a decline of 0.8 foot in New Mexico ( table 4). The pattern of water-level change in the High Plains aquifer from 1997 to 1998 ( fig. 7) is based on measurements from 7,808 wells ( fig. 8 and table 3). Ninety-nine percent of all water-level changes from 1997 to 1998 are within a rise of 8.4 feet and a decline of 9.4 feet. The largest nearly continuous area with greater than 3 feet of water-level decline is north of the Canadian River in Texas. The average area-weighted water level in the High Plains aquifer declined 0.2 foot from 1997 to 1998 ( table 4). The average area-weighted water-level change in the High Plains aquifer from 1997 to 1998 by state ranged from a rise of 0.2 foot in Wyoming to a decline of 0.8 foot in New Mexico ( table 4).
Figure 7. Generalized water-level changes in the High Plains aquifer, 1997 to 1998:
Figure 8. Wells measured in 1997 and 1998.
 The average area-weighted precipitation during 1997 in the High Plains region was 22.5 inches, or 2.6 inches greater than the 1961 to 1990 normal area-weighted annual precipitation ( table 5). In the central High Plains region, southern High Plains region, and western and north-central part of the northern High Plains region, 1997 precipitation was generally above normal; in the eastern and south-central part of the northern High Plains region, 1997 precipitation was generally less than normal ( fig. 9). The average area-weighted precipitation during 1997 in the High Plains region was 22.5 inches, or 2.6 inches greater than the 1961 to 1990 normal area-weighted annual precipitation ( table 5). In the central High Plains region, southern High Plains region, and western and north-central part of the northern High Plains region, 1997 precipitation was generally above normal; in the eastern and south-central part of the northern High Plains region, 1997 precipitation was generally less than normal ( fig. 9).
Figure 9. Generalized water-level changes in the High Plains aquifer, 1997 to 1998:
References
Gutentag, E.D., Heimes, F.J., Krothe, N.C., Luckey, R.R., and Weeks, J.B., 1984, Geohydrology of the High Plains aquifer in parts of Colorado, Kansas, Nebraska, New Mexico, Oklahoma, South Dakota, Texas, and Wyoming: U.S. Geological Survey Professional Paper 1400-B, 63 p.
Luckey, R.R., Gutentag, E.D., and Weeks, J.B., 1981, Water-level and saturated-thickness changes, predevelopment to 1980, in the High Plains aquifer in parts of Colorado, Kansas, Nebraska, New Mexico, Oklahoma, South Dakota, Texas, and Wyoming: U.S. Geological Survey Hydrologic Investigations Atlas HA-652, 2 sheets, scale 1:2,500,000.
National Oceanic and Atmospheric Administration, 1951-96, Climatological data set TD-3220: Asheville, N.C., National Climatic Center.
Thelin, G.P., and Heimes, F.J., 1987, Mapping irrigated cropland from Landsat data for determination of water use from the High Plains aquifer in parts of Colorado, Kansas, Nebraska, New Mexico, Oklahoma, South Dakota, Texas, and Wyoming: U.S. Geological Survey Professional Paper 1400-C, 38 p.
Weeks, J.B., and Gutentag, E.D., 1981, Bedrock geology, and altitude of base, and 1980 saturated thickness of the High Plains aquifer in parts of Colorado, Kansas, Nebraska, New Mexico, Oklahoma, South Dakota, Texas, and Wyoming: U.S. Geological Survey Hydrologic Investigations Atlas HA-648, 2 sheets, scale 1:250,000.
Weeks, J.B., Gutentag, E.D., Heimes, F.J., and Luckey, R.R., 1988, Summary of the High Plains regional aquifer-system analysis in parts of Colorado, Kansas, Nebraska, New Mexico, Oklahoma, South Dakota, Texas, and Wyoming: U.S. Geological Survey Professional Paper 1400-A, 30 p.
For more information, please contact:
USGS Water Science Center
5231 South 19th
Lincoln, Nebraska 68512
Phone (402) 328-4100
FAX (402) 328-4101
email [email protected]
 To view a PDF document, you need the Adobe Acrobat® Reader installed on your computer. (A free copy of the Acrobat® Reader may be downloaded from Adobe Systems Incorporated.) To view a PDF document, you need the Adobe Acrobat® Reader installed on your computer. (A free copy of the Acrobat® Reader may be downloaded from Adobe Systems Incorporated.)
 Back to High Plains Aquifer main page Back to High Plains Aquifer main page
|