 Follow us on Twitter! Follow us on Twitter!
DATA CENTER
INFORMATION CENTER
ABOUT THE NEBRASKA WSC
USGS IN YOUR STATE
USGS Water Science Centers are located in each state.
|
High Plains Aquifer Water-Level Monitoring Study
Water-Level Changes, 1980 to 1997, and Saturated Thickness, 1996-97, in the High Plains Aquifer
By V.L. McGuire, C.P. Stanton, and B.C. Fischer
U.S. Geological Survey
Fact Sheet FS-124-99
Lincoln, Nebraska
1999
 This report is also available in Adobe PDF format (2 Meg PDF). This report is also available in Adobe PDF format (2 Meg PDF).
Introduction
Water-Level Changes, 1980 to 1997 •
Water-Level Changes, 1996 to 1997, and Precipitation, 1996 •
Saturated Thickness, 1996-97 • References
The High Plains aquifer underlies one of the major agricultural regions in the world, including parts of eight States--Colorado, Kansas, Nebraska, New Mexico, Oklahoma, South Dakota, Texas, and Wyoming. In the area underlain by the High Plains aquifer (called the High Plains region in this report), the total number of acres irrigated with groundwater expanded rapidly after 1940: 1949--2.1 million acres; 1959--6.1 million acres; 1969--9.0 million acres; and 1980--13.7 million acres (Gutentag and others, 1984; Thelin and Heimes, 1987). In 1990, about 95 percent of the water withdrawn from the High Plains aquifer (about 15.7 million acre-feet) was used for irrigation (Marilee Horn, U.S.Geological Survey, written commun., 1996).
Water-level declines appeared in the High Plains aquifer soon after extensive ground-water irrigation development began. By 1980, water levels in the High Plains aquifer in parts of Texas, Oklahoma, and southwestern Kansas had declined more than 100 feet (Luckey and others, 1981). In response to these declines, the U.S. Geological Survey, in cooperation with numerous Federal, State, and local water resource agencies, began a ground-water monitoring program in 1988 to assess annual water-level change in the aquifer using water-level measurements from more than 7,000 wells. The purpose of this report is to present (1) water-level changes in the High Plains aquifer from 1980 to 1997 and from 1996 to 1997, (2) the precipitation pattern in the High Plains region during 1996, and (3) estimated saturated thickness of the High Plains aquifer in 1996-97. The water-level measurements used in this report were collected in winter or early spring when irrigation wells were not pumping. Map scale and density of water-level elevation data preclude showing small areas in the maps of water-level change and saturated thickness where the value may be more or less than indicated.
Water-Level Changes, 1980 to 1997
The water-level changes in the High Plains aquifer result from an imbalance between discharge, the largest component of which is ground-water withdrawals for irrigation, and recharge, which is primarily from precipitation. This imbalance began with large-scale development of the aquifer for irrigation. Ground-water withdrawals for irrigation in a given year can be affected by climatic conditions, particularly precipitation, which can cause large variations in the amount of irrigation water needed to satisfy the water requirements for crops.
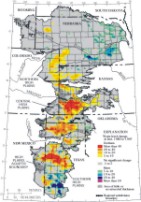
Figure 1. Water-level changes in the High Plains aquifer, 1980 to 1997. The pattern of water-level changes in the High Plains aquifer from 1980 to 1997 (fig. 1: view a larger screen image | high-resolution PDF image of water-level declines) is based on measurements from 5,233 wells (table 1). A large area in the northern part of the southern High Plains in New Mexico and Texas with greater than 100 feet of water-level declines from predevelopment to 1980 (Luckey and other, 1981) has continued to decline, but at slower rates. The average area-weighted rate of decline in this area from predevelopment to 1980 was 3.7 feet per year; the rate of decline in this area from 1980 to 1997 was 1.6 feet per year. Areas with substantial water-level decline from predevelopment to 1980 in the southern part of the southern High Plains in Texas and in the southeastern part of the northern High Plains in Nebraska (Luckey and other, 1981) had considerably slower rates of decline, or rising water levels, from 1980 to 1997.
Table 1. Number of High Plains aquifer wells measured for 1996 and 1997 and used for the water-level comparison periods-1980 to 1997 and 1996 to 1997.
-----------------------------------------------------------------------
                         Wells              Wells used for water-level
                     measured for:             comparison periods
     State    ---------------------------------------------------------
                   1996        1997       1980 to 1997    1996 to 1997
-----------------------------------------------------------------------
Colorado            604         604           502            579
Kansas            1,174       1,298           755            889
Nebraska          3,490       3,617         1,937          3,401
New Mexico          751         547           168            104
Oklahoma            298         268           171            256
South Dakota        114         105            70            100
Texas             2,903       2,581         1,617          2,364
Wyoming              83          63            13             62
-----------------------------------------------------------------------
High Plains       9,417       9,083         5,233          7,755
Ninety-nine percent of all water-level changes from 1980 to 1997 are within a rise of 32 feet and a decline of 60 feet. The average area-weighted water level in the High Plains aquifer declined 2.7 feet from 1980 to 1997 compared to a decline of 9.9 feet from predevelopment to 1980 (table 2). Assuming 1950 as the beginning of irrigation development in the High Plains region, the rate of water-level decline decreased from 0.33 foot per year (1950 to 1980) to 0.16 foot per year (1980 to 1997).
Table 2. Characteristics of the High Plains aquifer in 1980 and water-level changes in the High Plains aquifer, predevelopment to 1980, 1980 to 1997, and 1996 to 1997.
[ft, foot; ft/yr, foot per year]
                                Average area-weighted water-level change
                                 -------------------------------------------
                       Percentage         Predevelopment         1996 to
                       of total    1950 to 1980    1980 to 1997   1997
                       volume of -------------------------------------------
           Percentage  drainable  Water-          Water-          Water-
           of total    water in   level  Rate of  level  Rate of  level
           aquifer     storage    change3 change   change change   change
 State     area2        in 19802    (ft)   (ft/yr)  (ft)   (ft/yr)  (ft)
----------------------------------------------------------------------------
Colorado     8.2        3.7        -4.2   -0.14    -5.9   -0.35    +0.15
Kansas      16.2        9.9        -9.9   -0.33    -8.0   -0.47    +0.23
Nebraska    38.6       65.5         0.0    0.00    +2.3   +0.13    +0.58
New Mexico   3.6        1.5        -9.8   -0.33    -4.0   -0.23    -0.65
Oklahoma     4.2        3.4       -11.3   -0.38    -2.7   -0.16    +0.70
South Dakota 2.9        1.8         0.0    0.00    +3.1   +0.18    +0.82
Texas       21.5       12.0       -33.7   -1.12    -7.4   -0.43    -0.98
Wyoming      4.8        2.2         0.0    0.00    -1.5   -0.09    -0.24
----------------------------------------------------------------------------
High Plains  100        100        -9.9   -0.33    -2.7   -0.16    +0.08
----------------------------------------------------------------------------
    1 Does not include areas of little or no saturated thickness.
    2 Modified from Gutentag and others (1984).
    3 Luckey and others (1981).
Factors that contributed to the smaller rate of water-level decline from 1980 to 1997 as compared to predevelopment to 1980 are: (1) a decrease in ground-water withdrawals from the High Plains aquifer for irrigation, and (2) greater than normal precipitation from 1980 to 1996. Ground-water withdrawals for irrigation were 18.0 million acre-feet in 1980 and 15.7 million acre-feet in 1990 (Thelin and Heimes, 1987; Marilee Horn, U.S. Geological Survey, written commun., 1996). Precipitation from 1981 to 1996 in the High Plains region averaged 21.2 inches per year, 1.4 inches per year more than normal (table 3).
Table 3. Average area-weighted precipitation and comparison to 30-year normal precipitation (1961-90) in the High Plains region, 1981 to 1996, and 1996.
[Data from National Oceanic and Atmospheric Administration, National Climatic Data Center, Asheville, North Carolina; data values are in inches per year]
                    1981 to 1996                       1996
              --------------------------   -----------------------------
                            Departure                      Departure
               Average      from 30-year     Average       from 30-year
State        Precipitation  normal         precipitation   normal
------------------------------------------------------------------------
Colorado          17.5       +1.3               19.0        +2.8
Kansas            22.6       +1.3               26.7        +5.4
Nebraska          23.3       +1.5               24.1        +2.3
New Mexico        17.6       +1.3               15.4        -1.0
Oklahoma          21.3       +1.3               25.3        +5.3
South Dakota      20.3       +2.0               22.4        +4.0
Texas             20.1       +1.2               18.6        -0.3
Wyoming           15.6       +1.1               13.6        -0.9
-------------------------------------------------------------------------

High Plains       21.2       +1.4               22.0        +2.2
-------------------------------------------------------------------------
Factors that may have caused a decrease in ground-water withdrawals, in addition to increased precipitation, include: (1) a decrease in irrigated acreage in areas with water-level declines and in areas with large potential rates of aquifer depletion; (2) use of more efficient irrigation technology, such as low-pressure nozzles and drop tubes on center pivots; (3) improved farm-management practices, including irrigation scheduling, reuse of irrigation return flow, the conversion to alternative crops or crop varieties with smaller consumptive irrigation requirements, and methods to retain soil moisture; (4) local regulation of ground-water withdrawals for irrigation and development of irrigated land; and (5) economic considerations, including declining or stable commodity prices, increased production costs (including energy and fertilizer costs), and various agricultural programs of the Federal government that encourage the transfer of marginal land out of irrigated production.
Water-Level Changes, 1996 to 1997, and Precipitation, 1996
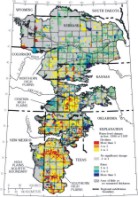
Figure 2. Generalized water-level changes in the High Plains aquifer, 1996 to 1997. Ninety-nine percent of all water-level changes from 1996 to 1997 (fig. 2: view a larger screen image | high-resolution PDF image) of water-level changes) are within a rise of 11.1 feet and a decline of 11.1 feet. The average area-weighted water level in the High Plains aquifer rose 0.08 foot from 1996 to 1997 (table 2) based on measurements from 7,755 wells (table 1). The average area-weighted water-level change in the High Plains aquifer from 1996 to 1997 by state ranged from a rise of 0.82 foot in South Dakota to a decline of 0.98 foot in Texas (table 2).
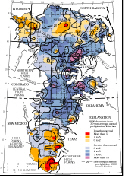
Figure 3. Annual precipitation, 1996 and departure from the 30-year normal precipitation (1961-90) (precipitation data from the National Oceanic and Atmospheric Administration, National Climatic Data Center, Asheville, North Carolina). The average area-weighted precipitation during 1996 in the High Plains region was 22.0 inches, or 2.2 inches greater than the 30-year normal (table 3). The precipitation pattern ranged from more than 10 inches greater than normal to more that 5 inches less than normal (fig. 3: view a larger screen image | high-resolution PDF image ).
Saturated Thickness, 1996-97
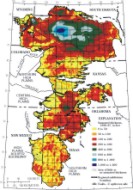
Figure 4. Saturated thickness of the High Plains aquifer, 1996-97 (modified from Weeks and Gutentag, 1981). A saturated-thickness map of the High Plains aquifer (fig. 4: view a larger screen image | high-resolution PDF image) was prepared by superimposing a 1996-97 water-table map over a map of the elevation of the base of the aquifer and contouring the elevation difference. The 1996-97 water-table map was based on 10,085 measurements-49 stream elevations (March 1997) and 10,036 water-level elevations in wells (1,370 from 1996 and 8,666 from 1997). A water level was used only if the land-surface elevation of the well had been determined; a 1996 water level was used only if the 1997 water level was not available for a given well. Within aquifer areas where there were no 1996 or 1997 measurements, such as in the northern High Plains in northeastern Wyoming, parts of western Nebraska, and north of the South Platte River in northeastern Colorado, the 1980 saturated-thickness contours were used (Weeks and Gutentag, 1981). Around the boundary of the aquifer, the contours were approximated.
Saturated thickness in 1996-97 ranged from generally 0 at the boundary of the aquifer to more than 1,000 feet in west-central Nebraska. The percentage of the area of the High Plains aquifer within each saturated thickness interval in 1980 (Gutentag and other, 1984) and in 1996-97 is summarized by state in table 4. The tabulated results show that the area of the High Plains aquifer with less than 100 feet of saturated thickness increased from 46 percent in 1980 to 49 percent in 1996-97.
Table 4. Saturated-thickness distribution in the High Plains aquifer, 1980 and 1996-97.
[ft, feet; < , less than]
           Area of                Percentage of area within each saturated
           High Plains                        thickness interval
           aquifer         -------------------------------------------------
           within               0-100 ft       100-  200-  400-  600-  800-
           State¹         --------------------- 200   400   600   800  1,200
 State     (mi² )    Year²   0-50 ft   0-100 ft  ft    ft    ft    ft    ft
----------------------------------------------------------------------------
Colorado   14,900    1980         76           18     6    --    --    --
                   1996-97   58        23      15     4    --    --    --
Kansas     30,500    1980         66           21    12     1    --    --
                   1996-97   51        19      18    11     1    --    --
Nebraska   63,650    1980         14           21    29    22    10     4
                   1996-97    9         8      20    28    22     9     4
New Mexico  9,450    1980         85           15    --    --    --    --
                   1996-97   72        17      11    --    --    --    --
Oklahoma    7,350    1980         58           25    11     6    --    --
                   1996-97   35        21      28    12     4    --    --
S. Dakota   4,750    1980         44           13    25    18    --    --
                   1996-97   26        12      15    32    15    --    --
Texas      35,450    1980         61           25    14    --    --    --
                   1996-97   33        32     <23    12    <1    --    --
Wyoming     8,000    1980         46           26    18     4     4     2
                   1996-97   41         7      28    16    <5    <4    <1
----------------------------------------------------------------------------

High      174,050    1980         46           22    18     9     4     1
Plains             1996-97   32        17      20    17     9     4     1
----------------------------------------------------------------------------
    1Luckey and others (1981), includes areas of little or no saturated
           thickness.
    2All 1980 values are from Gutentag and others (1984).
References
SELECTED REFERENCES
Gutentag, E.D., Heimes, F.J., Krothe, N.C., Luckey, R.R., and Weeks, J.B., 1984, Geohydrology of the High Plains aquifer in parts of Colorado, Kansas, Nebraska, New Mexico, Oklahoma, South Dakota, Texas, and Wyoming: U.S. Geological Survey Professional Paper 1400-B, 63 p.
Luckey, R.R., Gutentag, E.D., and Weeks, J.B., 1981, Water-level and saturated-thickness changes, predevelopment to 1980, in the High Plains aquifer in parts of Colorado, Kansas, Nebraska, New Mexico, Oklahoma, South Dakota, Texas, and Wyoming: U.S. Geological Survey Hydrologic Investigations Atlas HA-652, 2 sheets, scale 1:2,500,000.
National Oceanic and Atmospheric Administration, 1951-96, Climatological data set TD-3220: Asheville, N.C., National Climatic Center.
Thelin, G.P., and Heimes, F.J., 1987, Mapping irrigated cropland from Landsat data for determination of water use from the High Plains aquifer in parts of Colorado, Kansas, Nebraska, New Mexico, Oklahoma, South Dakota, Texas, and Wyoming: U.S. Geological Survey Professional Paper 1400-C, 38 p.
Weeks, J.B., and Gutentag, E.D., 1981, Bedrock geology, altitude of base, and 1980 saturated thickness of the high Plains aquifer in parts of Colorado, Kansas, Nebraska, New Mexico, Oklahoma, South Dakota, Texas, and Wyoming: U.S. Geological Survey Hydrologic Investigations Atlas HA-648, 2 sheets, scale 1:2,500,000.
For more information, please contact:
USGS Water Science Center
5231 South 19th
Lincoln, Nebraska 68512
Phone (402) 328-4100
FAX (402) 328-4101
email [email protected]
To view a PDF document, you need the Adobe Acrobat® Reader installed on your computer. (A free copy of the Acrobat® Reader may be downloaded from Adobe Systems Incorporated.)
 Back to High Plains Aquifer main page Back to High Plains Aquifer main page
|