
"Reprinted" from Geocarto International, December 1995, v. 10, no. 4, p. 69-80.
Jesslyn F. Brown
Michael S. Kelley
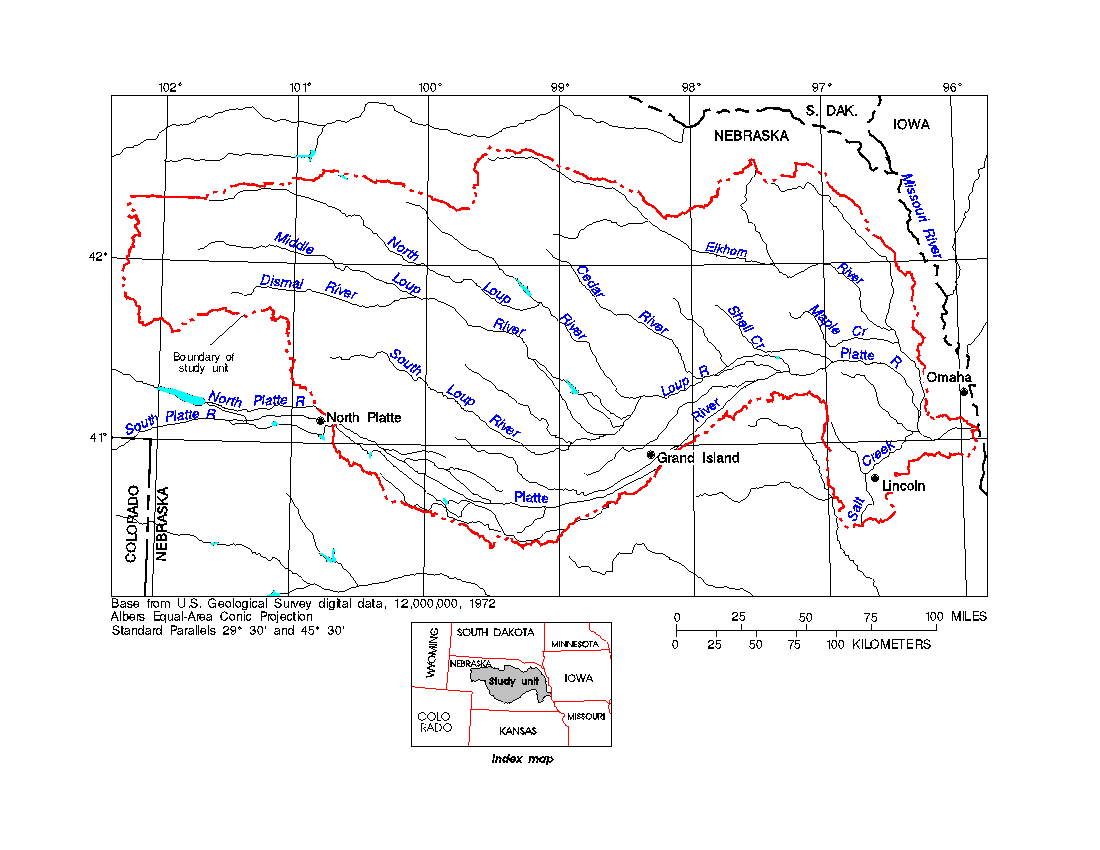
One of the initial planning activities undertaken in each of the 60 NAWQA study-unit investigations is the development of a strategy for acquiring data sets that provide quantitative information about the ancillary variables that may affect water-quality conditions in the study unit. In developing such a plan, investigators evaluated the availability and suitability of existing data for satisfying the program objectives. During the period of time when the initial 20 NAWQA study-unit investigations were evaluating existing land-cover data, a Prototype 1990 Conterminous U.S. Land Cover Characteristics Data Set (U.S. Geological Survey and University of Nebraska-Lincoln, 1993) was produced by the USGS EROS Data Center (EDC), in collaboration with the Center for Advanced Land Management Information Technologies (CALMIT) of the University of Nebraska-Lincoln (UNL), as part of the U.S. Global Change Research Program. The purpose of the data set was to provide a national synoptic overview of land-cover characteristics to complement other sources of land-cover data.
Some properties of the EDC/CALMIT data set were determined by the satellite image data from which it primarily was developed. National Oceanic and Atmospheric Administration (NOAA) Advanced Very High Resolution Radiometer (AVHRR) sensors are carried aboard two NOAA satellites in high polar orbits. Most of the globe is scanned twice daily, and the resulting data are gridded using nominally 1-km2 pixels. To minimize the effects of cloud cover and to manage the large volume of data, EDC researchers derived 28-day maximum-value composite images of a vegetation "greenness" index (the normalized-difference vegetation index) computed from 1990 AVHRR spectral-reflectance data (Eidenshink, 1992). To be successful, the compositing procedure requires precise geometric registration of each daily image to a common coordinate system. A systematic geometric correction based on a satellite-platform model was followed by a precision correction using image-to-image correlation with a reference image having a verified geometric accuracy (root-mean-square error) within 1.0 pixel (Kelly and Hood, 1991). Eight composite images summarize the phenological changes in flora for March through October 1990.
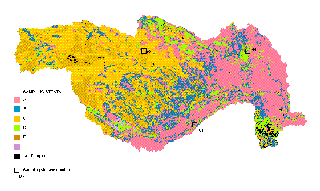
Loveland et al. (1991) described the analytic methods by which an unsupervised clustering algorithm was used with the eight composite images to define 70 vegetation classes (spectro-temporal or "seasonally distinct" classes) that were distinguishable by their vegetation-index values through 1990. Most of the 70 preliminary classes were subdivided on the basis of ancillary geographic data (elevation, ecological regions, and frost-free period) to produce a final classification representing 159 seasonally distinct land-cover (SDLC) regions (Brown et al., 1993). A variety of existing digital and conventional maps, photographs, and images was evaluated to determine the characteristics of the 159 regions. The resulting descriptive labels (examples in Table 2) are the investigators' best estimate of the land-cover types associated with each region, as viewed from a nationwide perspective. The labels are qualitative descriptions only and, where they indicate multiple land-cover types within a region, do not indicate which types predominate or in what relative proportions they typically occur.
Merchant et al. (in press) report results from several attempts at non-site-specific validation of the 1990 SDLC region labels as encouraging but inconclusive. Site-specific verification of the SDLC regions is in progress, but results are not available yet.
The spatial resolution of the AVHRR scanner is sufficiently coarse that the field of view may include several land-cover types having heterogeneous spectral-reflectance properties. The resulting mixed pixels in the digital image do not record spectral reflectance for a particular land cover, but rather an average of reflectances from the various features. This complication is not limited to coarse spatial-resolution data. For example, using high spatial-resolution imagery, Fung and Chan (1994) examined the spatial composition of the several spectral classes that were associated with test sites representing a single land-use/land-cover type. Most of their test sites were characterized by considerable spectral heterogeneity. However, by quantifying the spatial composition at their test sites, Fung and Chan were able to identify the dominant spectral classes for each land-use/land-cover type. This suggests that by quantifying the spatial composition at test sites corresponding to AVHRR pixels, quantitative estimates of the extent of each land-cover type can be obtained for areas defined on the basis of the SDLC regions in the EDC/CALMIT data set. Moody and Woodcock (1994) also have suggested that land-cover classes based on image data having 1-km spatial resolution be defined in terms of mixtures of land-cover types for which the proportions could be estimated.
 (27
kb, gif)
(27
kb, gif)
Because various types of land cover have differing spectral reflectance properties and because the spatial organization of land cover varies among physiographic and ecological regions, the homogeneity of land-cover characteristics of SDLC regions within the CNB study unit was expected to be greater than for the study unit as a whole. Therefore, the stratified-random sampling design based on the SDLC regions that was selected for this study was expected to produce more precise estimates of land cover for areal units than would simple random sampling.
Within each sampling stratum, sites were chosen using simple random selection. Thirty-five 1-km2 sampling sites were selected from each of the six sampling strata, yielding a total of 210 sampling sites. Because all of the 1-km2 cells from each SDLC region either were included in or excluded from each sampling stratum, each cell within a SDLC region had an equal probability of being selected.
To assist the investigators in locating each sampling site with respect to observable reference features on the land, the sampling-site boundary was plotted on transparent film at a scale of 1:24,000 and registered as an overlay to the corresponding USGS 7.5-minute topographic quadrangle map.
Color-infrared aerial photography at a nominal scale of 1:40,000 was acquired by the USGS National Aerial Photography Program (NAPP) for all of Nebraska during 1987-90. A black-and-white print of a NAPP photograph of each sampling site was supplied to the observers to provide detailed spatial reference material for locating sampling sites in the field and to serve as a base for recording observed land-cover features.
The identity and location of land-cover features at each sampling site were determined by visual inspection. For the 21 sites to which access permission was not secured or which were otherwise inaccessible to the observer, land-cover data were determined by interpretation of the aerial photography. No attempt was made to compensate for the date of the photographs being prior to 1993, but all of the inaccessible sites were in rangeland-dominated areas that have exhibited minimal change in land cover.
The areal extent of the land-cover types of interest was delineated on the aerial photograph (Figure 3) and labeled with an alphabetic code corresponding to one of the land-cover categories listed in Table 1. To document the onsite observations photographically, three to five photographs generally were taken at each site using 35-mm color film. The first photograph for each site included the site number (Figures 3b, 3c) to document the site identity of each group of photographs.
| Land-cover category | Category definition |
|---|---|
| Corn | Features showing evidence that area is planted to this crop |
| Sorghum | Features showing evidence that area is planted to this crop |
| Soybeans | Features showing evidence that area is planted to this crop |
| Wheat, oats, barley, or rye | Features showing evidence that area is planted to one of these crops |
| Alfalfa | Features showing evidence that area is planted to this crop |
| Other hay or grass | < 50% tree closure |
| Forest or woodlands | > 50% tree closure |
| Emergent aquatic vegetation | < 50% open water |
| Urban or built-up | Commercial, residential, industrial, or transportation structures |
| Barren land | < 50% vegetated |
| Open water | < 50% emergent aquatic-vegetation zones |
 (292
kb, gif)
(292
kb, gif)  (265
kb, gif)
(265
kb, gif) 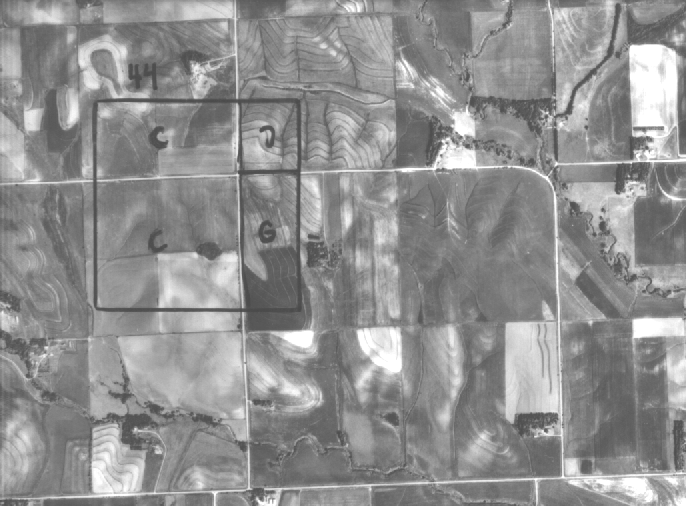 (289
kb, gif)
(289
kb, gif) | Sampling stratum |
Seasonally distinct land-cover region number and label |
Area as a percentage of study unit |
|---|---|---|
| A | 10 Soybeans, cotton, rice, corn | 0.5 |
| 11 Corn, soybeans | 10.5 | |
| 17 Corn, soybeans | 15.9 | |
| 27 Irrigated crops | .3 | |
| 34 Irrigated crops, mixed row crops | 5.7 | |
| B | 5 Small grains, mixed row crops | 1.3 |
| 6 Mixed row crops, small grains | .4 | |
| 7 Mixed crops | .9 | |
| 13 Small grains, mixed row crops, pasture | .6 | |
| 14 Mixed crops | 12.9 | |
| 16 Corn, soybeans, alfalfa, flax, wheat | .1 | |
| C | 35 Grass, small grains | 20.8 |
| 36 Grass, wheat, sorghum | .2 | |
| 37 Small grains, sorghum, grass | < .1 | |
| 38 Grass, wheat, peas, lentils | < .1 | |
| 39 Grass, wheat, sorghum | 7.0 | |
| D | 40 Woods, irrigated crops, grass | .4 |
| 42 Corn, soybeans, sorghum, irrigated crops, mixed woodlots | 3.5 | |
| 46 Woods, corn, soybeans, pasture | 2.1 | |
| 47 Woods, soybeans, corn, pasture | .6 | |
| 52 Forage crops, hay, woodlots | .6 | |
| E | 58 Grass | .4 |
| 59 Grass | 7.4 | |
| 61 Grass | .1 | |
| 64 Grass | 3.0 | |
| 65 Grass | 3.6 | |
| F | 91 Woods, pasture | .3 |
| 93 Woods, pasture | < .1 |
In addition to quantifying the land-cover composition for each sampling site, descriptive and inferential statistics were computed to summarize the data for each sampling stratum. Stephens' approximation (D'Agostino and Stephens, 1986, chapter 5) of the Shapiro-Wilk test for normality was applied to the sample data from each stratum. The median percentage of site coverage was computed for each land-cover category by stratum. Nonparametric confidence intervals for the medians were computed at the 95-percent confidence level.
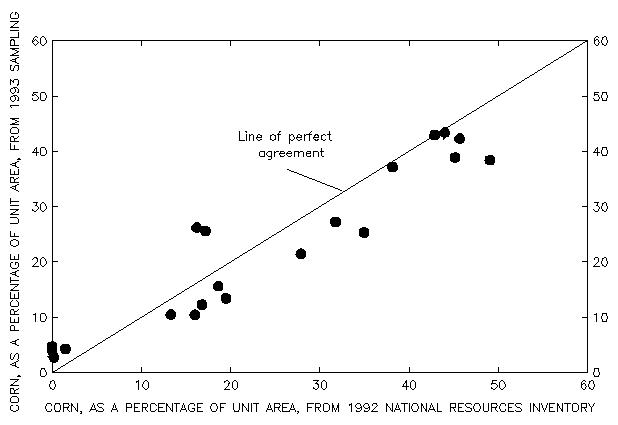
Areal land-cover estimates were computed for selected land-cover categories for areal units corresponding to the USGS hydrologic cataloging units (Seaber et al., 1986). The estimates were areally weighted sums of the summary statistics for the strata that composed each hydrologic unit. Three estimates were made using three summary statistics: the median, the lower limit of the confidence interval for the median, and the upper limit of the confidence interval. As a preliminary check on their validity, these estimates were compared to an independent source of land-cover data for hydrologic cataloging units--the 1992 National Resources Inventory (U.S. Department of Agriculture, Soil Conservation Service, 1994). Results from the 1992 National Resources Inventory are sample-based estimates that have a margin of error of 5% or less at the substate level and larger margins of error for smaller areal units.
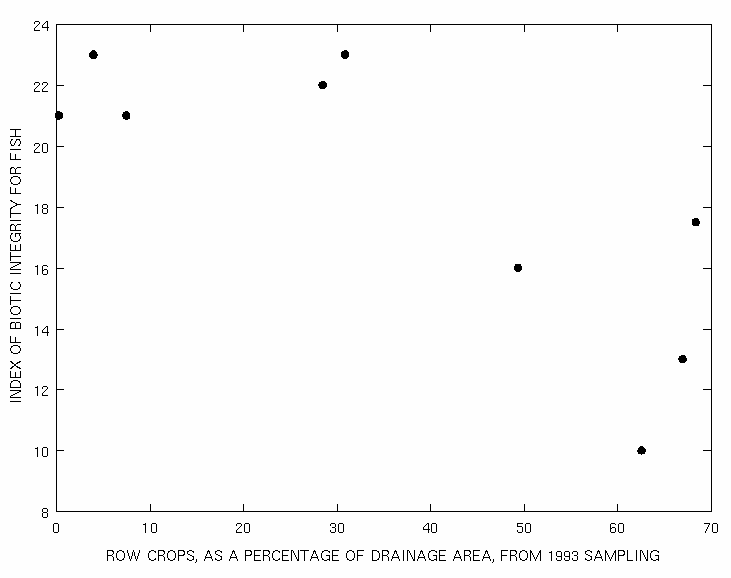
To support the interpretation of water-quality data, the percentage of nine selected surface-water drainage areas covered by row crops (corn, sorghum, and soybeans) was estimated using areally weighted sums of the median row-crops percentage for each sampling stratum. Those estimates were then compared with differences between the streams in terms of water-quality metrics, such as the index of biotic integrity (IBI) for fish (Karr, 1981). The IBI values were averages for fish samples collected during 1993-94 at the downstream end of each of the nine selected drainage areas.
The simple random selection of 35 sampling sites within each stratum has a limitation that is evident in the results shown in Table 3; the sample-based estimates of percentages of minor land-cover categories are too small. Either a much larger sample size or a more sophisticated sampling design would be needed to provide better estimates for minor land-cover categories.
| Sampling | Percentage of site covered by indicated land-cover category | |||||
|---|---|---|---|---|---|---|
| stratum | Corn | Sorghum | Soybeans | Alfalfa | Wheat, etc. | Grass |
| Upper limit of 95-percent confidence interval for stratum medians | ||||||
| A | 61 | 0 | 23 | 0 | 0 | 25 |
| B | 41 | 0 | 0 | 2 | 0 | 84 |
| C | 0 | 0 | 0 | 0 | 0 | 100 |
| D | 24 | 0 | 0 | 1 | 0 | 91 |
| E | 0 | 0 | 0 | 0 | 0 | 100 |
| F | 72 | 0 | 0 | 21 | 0 | 5 |
| Stratum medians | ||||||
| A | 50 | 0 | 7 | 0 | 0 | 14 |
| B | 22 | 0 | 0 | 0 | 0 | 65 |
| C | 0 | 0 | 0 | 0 | 0 | 100 |
| D | 6 | 0 | 0 | 0 | 0 | 56 |
| E | 0 | 0 | 0 | 0 | 0 | 100 |
| F | 67 | 0 | 0 | 10 | 0 | 0 |
| Lower limit of 95-percent confidence interval for stratum medians | ||||||
| A | 33 | 0 | 0 | 0 | 0 | 10 |
| B | 0 | 0 | 0 | 0 | 0 | 45 |
| C | 0 | 0 | 0 | 0 | 0 | 94 |
| D | 0 | 0 | 0 | 0 | 0 | 27 |
| E | 0 | 0 | 0 | 0 | 0 | 100 |
| F | 55 | 0 | 0 | 6 | 0 | 0 |
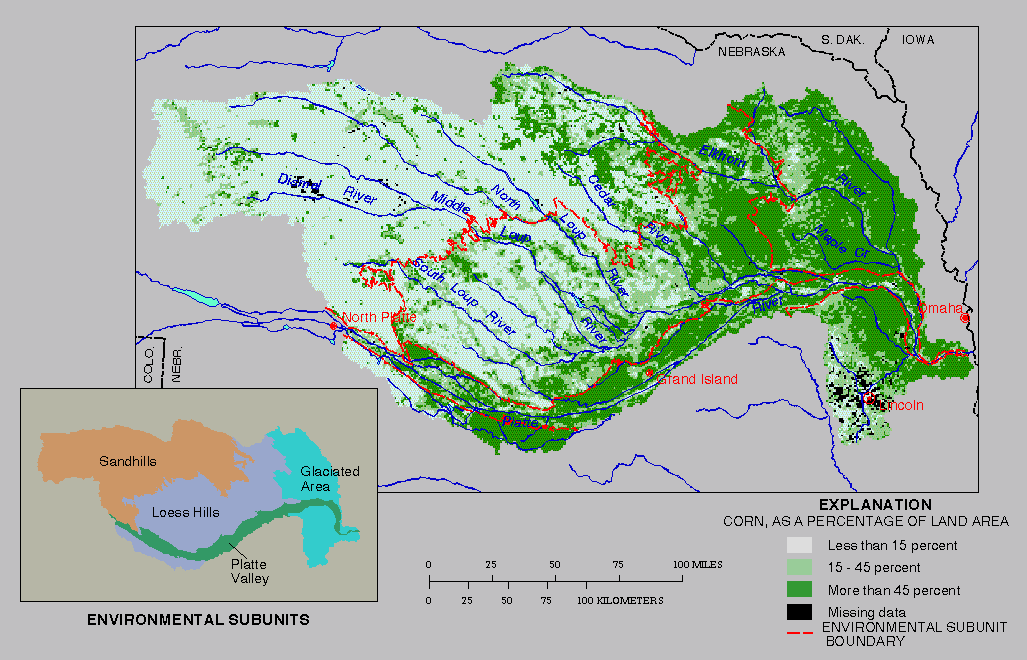
To prepare a map displaying the spatial distribution of the median estimate of the percentage of area covered by corn, a three-step procedure was used. First, each 1-km2 cell that was classified in one of the eight SDLC regions from which 11 or more samples were collected in 1993 was assigned the percentage-corn median computed for its SDLC region. Next, the cells from the remaining SDLC regions that were included in the six sampling strata were assigned their respective stratum-median percentage-corn values. Finally, the resultant derived data set was displayed with range-graded symbology (Figure 7). The map displays spatial patterns in the density of corn production that are related to physiographic/environmental subunits of the study unit (Figure 7 inset). The Sandhills subunit has relatively little corn cover, whereas the Platte Valley and Glaciated Area subunits are characterized mostly by intensive corn production. The map contributes to a useful conceptual model of current land-cover characteristics in the study unit.
 (33
kb, gif)
(33
kb, gif)Additional sites in the CNB study unit are being sampled in 1994 to reduce the uncertainty about the sample median statistics for a revised set of sampling strata that are based on individual SDLC regions. Areal estimates of land-cover composition during 1993-1994 are becoming available from independent sources, such as the U.S. Department of Agriculture's National Agricultural Statistics Service. It is expected that comparisons of the final results of this study with results from independent sources will be of interest to regional investigators that require updated estimates of selected land-cover characteristics for a particular year or study area in which data from other sources may not be available.
D'Agostino, R.B., and M.A. Stephens (editors). 1986. Goodness of Fit Techniques. New York: Marcel-Dekker. 560 pgs.
Eidenshink, J.C. 1992. The 1990 Conterminous U.S. AVHRR Data Set. Photogrammetric Engineering and Remote Sensing. 58(6):809-813.
Fung, T., and K.-C. Chan. 1994. Spatial Composition of Spectral Classes: A Structural Approach for Image Analysis of Heterogeneous Land-use and Land-cover Types: Photogrammetric Engineering and Remote Sensing. 60(2):173-180.
Goolsby, D.A., W.A. Battaglin, and E.M. Thurman. 1993. Occurrence and Transport of Agricultural Chemicals in the Mississippi River Basin, July Through August 1993. U.S. Geological Survey Circular 1120-C. 22 pgs.
Goolsby, D.A., R.C. Coupe, and D.J. Markovchick. 1991. Distribution of Selected Herbicides and Nitrate in the Mississippi River and its Major Tributaries, April Through June 1991. U.S. Geological Survey Water-Resources Investigations Report 91-4163. 35 pgs.
Helsel, D.R., and R.M. Hirsch. 1992. Statistical Methods in Water Resources. Amsterdam: Elsevier Publishers. 522 pgs.
Karr, J.R. 1981. Assessment of Biotic Integrity Using Fish Communities: Fisheries (Bethesda). 6(6):21-27.
Kellogg, R.L., M.S. Maizel, and D.W. Goss. 1992. Agricultural Chemical Use and Ground Water Quality: Where Are the Potential Problem Areas?. Washington, D.C.: U.S. Department of Agriculture and National Center for Resource Innovations. 41 pgs., appendices.
Kelly, G.G., and JJ. Hood. 1991. AVHRR Conterminous United States Reference Data Set: Technical Papers, 1991 ACSM-ASPRS Annual Convention. 3: 232-239.
Leahy, P.P., J.S. Rosenshein, and D.S. Knopman. 1990. Implementation Plan for the National Water-Quality Assessment Program. U.S. Geological Survey Open-File Report 90-174. 10 pgs.
Loveland, T.R., J.W. Merchant, D.O. Ohlen, and J.F. Brown. 1991. Development of a Land-cover Characteristics Database for the Conterminous U.S. Photogrammetric Engineering and Remote Sensing. 57(11):1453-1463.
Merchant, J.W., L. Yang, and W. Yang. In press. Validation of Continental-Scale Land Cover Data Bases Developed From AVHRR Data. In: William T. Pecora Memorial Symposium on Remote Sensing (12th). Proceedings. Sioux Falls, SD. August, 1993. Bethesda, MD: American Society for Photogrammetry and Remote Sensing.
Moody, A., and C.E. Woodcock. 1994. Scale-Dependent Errors in the Estimation of Land-Cover Proportions: Implications for Global Land-Cover Datasets. Photogrammetric Engineering and Remote Sensing. 60(5):585-594.
Seaber, P.R., F.P. Kapinos, and G.L. Knapp. 1986. Hydrologic Unit Maps. U.S. Geological Survey Water-Supply Paper 2294. 63 pgs.
Stamer, J.K., and T.L Huntzinger. 1994. Spring Herbicide "Flush" May Deal Cities a Problem. Nebraska Farmer. 136(8):10-13.
Stamer, J.K., and R.B. Zelt. 1994. Organonitrogen Herbicides in the Lower Kansas River Basin. Journal American Water Works Association. 86(1):93-104.
U.S. Department of Agriculture, Soil Conservation Service. 1994. 1992 National Resources Inventory. Fort Worth, TX: Soil Conservation Service. 4 compact discs.
U.S. Geological Survey and University of Nebraska-Lincoln. 1993. Prototype 1990 Conterminous U.S. Land Cover Characteristics Data Set. Sioux Falls, SD: U.S. Geological Survey, EROS Data Center. 1 compact disc.
|
||||||||||
|
||||||||||